Compensate the active trace for the average slope and response value.
 Effect
and purpose of the linearity deviation calculation
Effect
and purpose of the linearity deviation calculation
To obtain the Linearity Deviation trace, the analyzer calculates a regression line to all trace points. The corrected trace is based on the deviation dlin of each trace point from the regression line:
The effect of the operation on an almost straight trace is shown below.
The Linearity Deviation operation is useful in all applications where the deviation of the trace from linearity is investigated, e.g. the mixer delay measurement.
The Linearity Deviation functions are selected from a submenu:
Manual... calls up dialog for manual entry of the correction factors.
Auto calculates the correction factors from the measured trace using a regression line.
On / Tracking / Off are alternative functions to enable/disable the correction and re-calculate it for each trace.
The Linearity Deviation Manual dialog is used for manual entry of the correction factors.
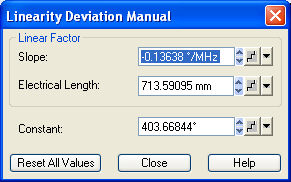
When it is opened, the dialog shows the latest set of correction values used.
Slope and Constant can be set irrespective of the active trace format.
Electrical Length is available if the active trace shows the phase vs. frequency. The electrical length is calculated as the negative slope times the velocity of light divided by a factor of 360°. Entry of a slope or an electrical length is equivalent; the values overwrite each other.
Reset All Values sets all values to zero. This effectively disables the linearity deviation correction.
|
Remote control: |
CALCulate<
Chn >:LDEViation:SLOPe
|
Initiates a (re-)calculation of the linearity deviation from the active measured trace.
|
Remote control: |
On / Off and Tracking are alternative functions to apply/discard the correction factors or re-calculate them for each trace (Tracking).
While On or Tracking is selected, the correction factors are displayed in an info field.
|
Remote control: |
