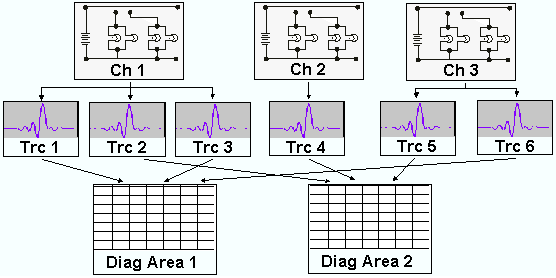
The analyzer arranges, displays or stores the measured data in traces which are assigned to channels and displayed in diagram areas. To understand the menu structure of the instrument and quickly find the appropriate settings, it is important to understand the exact meaning of the three terms.
A trace is a set of data points that can be displayed together in a diagram area. The trace settings specify the mathematical operations used in order to obtain traces from the measured or stored data and to display them.
A channel contains hardware-related settings to specify how the network analyzer collects data.
A diagram area is a rectangular portion of the screen used to display traces. Diagram areas belonging to the same setup are arranged in a common window.
A diagram area can contain a practically unlimited number of traces, assigned to different channels. Diagram areas and channels are completely independent from each other.
The trace settings specify the mathematical operations used in order to obtain traces from the measured or stored data. They can be divided into several main groups:
Selection of the measured quantity (S-parameters, wave quantities, ratios, impedances,...)
Conversion into the appropriate display format and selection of the diagram type
Scaling of the diagram and selection of the traces associated to the same channel
Readout and search of particular values on the trace by means of markers
Limit check
The Trace menu provides all trace settings. They complement the definitions of the Channel menu. Each trace is assigned to a channel. The channel settings apply to all traces assigned to the channel.
 If a trace is selected in order to apply the
trace settings, it becomes the active
trace. In manual control there is always exactly
one active trace, irrespective of the number of channels and traces defined.
The active channel contains the active trace. In remote control, each channel
contains an active trace; see Active Traces in Remote Control.
If a trace is selected in order to apply the
trace settings, it becomes the active
trace. In manual control there is always exactly
one active trace, irrespective of the number of channels and traces defined.
The active channel contains the active trace. In remote control, each channel
contains an active trace; see Active Traces in Remote Control.
A channel contains hardware-related settings to specify how the network analyzer collects data. The channel settings can be divided into three main groups:
Control of the measurement process (Sweep, Trigger, Average)
Description of the test setup (Power of the internal source, IF filter Bandwidth and Step Attenuators, Port Configuration)
Correction data (Calibration, Offset)
The Channel menu provides all channel settings.
After
changing the channel settings or selecting another measured quantity,
the analyzer needs some time to initialize the new sweep. This preparation
period increases with the number of points and the number of partial measurements
involved. It is visualized by a Preparing
Sweep symbol in the status
bar:

All analyzer settings can still be changed during sweep initialization.
If necessary, the analyzer terminates the current initialization and starts
a new preparation period.
During the first sweep after a change of the channel settings, an additional
red asterisk symbol appears in the status bar: